

Read a year of coverage before the committee meets
"Are Fridays actually covered?" deserves better than an impression. The year view answers it with the record: one row for each standing schedule, and fifty-two weekly cells coloured by how full each rota actually was when it ran.
Open the year view
From your trustee account, open Year coverage from the menu (☰) (or the coverage line on your Safeguarding dashboard). You will see:
- One row per standing schedule: Jummah, a second jama'ah, Madrasa Saturdays, whatever your mosque runs on repeat.
- Fifty-two cells per row, the trailing twelve months, oldest on the start side. Each cell's colour follows the key underneath, and every cell also carries its exact figure, so colour is never the only signal.
- A year average per row: total seats filled over total seats asked for, across every week the schedule was expected to run.
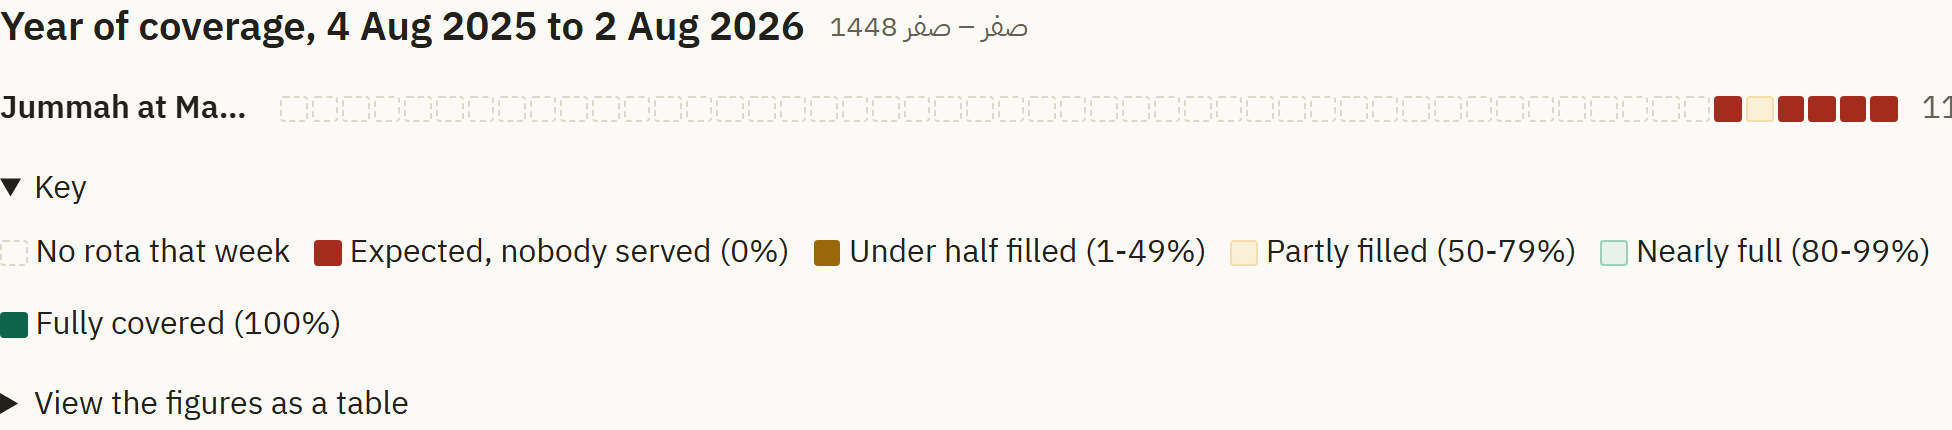
What the cells mean
- Fully covered through to nobody served (0%): the rota ran (or was due) that week; the figure is how many of its seats were filled at the time. A 0% week is an honest zero. The mosque was owed a rota and no one could serve, including weeks where the rota was never published at all.
- No rota: nothing was expected that week, whether before the schedule began, a deliberately skipped date (half-term), or after a series ended. It is a gap, not a failure, and it never drags an average down.
A young schedule is measuring, not failing
A schedule that started recently has mostly empty cells. That is newness, not a problem. While a view has fewer than four observed weeks of history (a month of Fridays is the smallest honest trend), the year view says so in plain words, and the coverage line on your Safeguarding dashboard reads "still measuring" with the real number of weeks instead of a percentage. The moment the fourth week is in, the honest figure takes over.
From a dip to its explanation
Tap any cell (or its week in the table) and that week opens beneath the heatmap: which rotas ran, on which dates, and how full each one was. The anomaly and its explanation sit one tap apart. Take that to the meeting instead of a guess.
For the meeting pack
Print the page and the figures print as a table: every week, every schedule, every number. Screen-reader users get the same table on screen via View the figures as a table.
The year view shows fill rates and schedule names only, never volunteer names, phone numbers or safeguarding details. It reads the same facts the coordinator's board already shows, summed up over a year.